Even though the Community Reinvestment Act does not apply to independent mortgage banks, these nonbank lenders provide a higher share of their mortgages in minority and low- and moderate-income neighborhoods than banks do, according to a new report from the Urban Institute.
Urban Institute researchers looked at lending nationally and in about a dozen states that have some level of state-based Community Reinvestment Act regulations, or are considering these regulations.
“[D]espite the fact that IMBs are currently examined under CRA rules only in Massachusetts, IMBs are significantly more active in LMI and minority lending than their bank counterparts,” the report said.
While Illinois and New York have passed laws that would assess IMBs for CRA, these regulations have not been implemented.
Commissioned and funded by the Mortgage Bankers Association, the report followed the Urban Institute’s research from February 2022, which showed that nonbank lenders provided more mortgages to people of color compared to other lenders. The MBA requested an additional analysis of lending in low- and moderate-income communities and minority neighborhoods. Released this month, the report used information from the American Community Survey and expanded 2021 Home Mortgage Disclosure Act data.
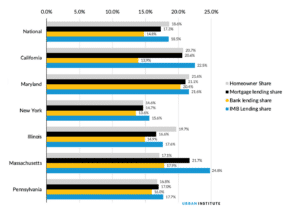
The report found that nationwide, 18.6 percent of homeowners live in LMI communities, and IMBs did 18.5 percent of their total lending in these communities. Credit unions did 16.4 percent of their lending in these communities, and banks did 14.8 percent of lending there.
While all lenders did less mortgage lending in minority neighborhoods compared to the share of homeowners, nonbanks still did a higher share of its lending in these neighborhoods compared to banks and credit unions. While 10.8 percent of homeowners live in predominantly minority neighborhoods, these areas received 9.3 percent of nonbank lending, 4.6 percent of credit union lending and 5.7 percent of bank lending.
And while 6 percent of homeowners live in LMI neighborhoods that are also predominantly minority, these communities received 4.9 percent of nonbank lending, 2.5 percent of credit union lending and 3.2 percent of bank lending.
“We found that even compared with the persistently low minority homeownership rate, minority neighborhoods do not receive their proportionate share of purchase loans from institutions either covered or not covered by the CRA, though the IMBs showed the smallest shortfall,” the report said.
The Urban Institute’s analysis found similar patterns in states that have CRA laws or are considering them, but Massachusetts did see a higher share of lending in LMI and minority neighborhoods.
In Massachusetts, 17.1 percent of homeowners live in LMI communities, and nonbank lenders did 24.8 percent of their total lending in these communities. Credit unions did 16.6 percent of their lending in these communities, and banks did 17.9 percent of lending there.
While the state has a smaller share of homeowners living in minority neighborhoods compared to the national results, nonbank lenders provided a higher share of mortgages in these neighborhoods. Massachusetts has 2.3 percent of homeowners living in predominantly minority neighborhoods, and these areas received 3.3 percent of nonbank lending, 1.1 percent of credit union lending and 2.3 percent of bank lending.
LMI neighborhoods that are predominantly minority have 2.2 percent of the state’s homeowners, and these communities received 3.1 percent of nonbank lending, 1 percent of credit union lending and 2.2 percent of bank lending.


