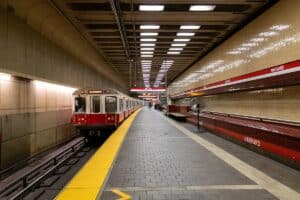
An outbound Red Line train at the upper platform in the MBTA's Harvard station in August 2021. Photo by Hutima | CC BY-SA 4.0
For Red Line commuters who have suffered through months of slow zones and more than a year of service cuts, an eight-minute trip from Harvard Square to Park Street might sound like a pipedream. But that wasn’t always the case.
As advocacy group TransitMatters pointed out Monday, there was a time when making that Cambridge-to-Boston journey in only eight minutes was a selling point emblazoned on a large advertisement atop the Harvard Square subway station.
The group published a picture of the sign offering “rapid transit 8 minutes to Park St.,” which records suggest was taken between 1954 and 1959, in a blog post outlining new features available on its refurbished data dashboard that tracks trip times, service volumes and slowdowns across the subway system.
“Today’s Red Line riders might find the photo above surprising. In the mid-1950s, a trip from Harvard to Park Street appeared to take eight minutes. Today it takes 50 percent longer than that,” TransitMatters wrote. “If we want to hold our transit system to a standard we know can be achieved, we need a detailed record of what used to be possible. And, fundamentally, that’s what the Data Dashboard is for. We’re building this for the transit riders of today, but also for the 2030s, 2040s, and beyond. Of course, we hope that they’ll be enjoying a more expansive and functional system. But as likely as not, they’ll find echoes of their problems in the ones we’re facing now.”
The dashboard reports several years of data about speed, ridership and service data for all four subway lines, trip time impacts from widespread slow zones for the Red, Blue and Orange Lines, and ridership and travel details for many bus routes.
Taken together, the data quantify many of the problems plaguing the system.
For example, the Red Line typically ran about 200 round trips per weekday in May 2022, before MBTA officials slashed frequency in response to a federal investigation that found the dispatcher workforce was stretched too thin to operate safely, according to TransitMatters data. Last week, service on the Red Line averaged 124 trips per weekday, the data show.
TransitMatters analysis was released a day before the T announced it had cleared a significant speed restriction on the Orange Line near Tufts Medical Center. Deteriorated track had meant trains had been running through the nearly 1,000-foot section of northbound and southbound tunnel at only 10 miles per hour as far back as 2019. Following work done in the August and September Orange Line shutdown last year, the T said it raised the speed limit to 18 miles per hour but it wasn’t until recent work was completed that trains will now be able to round the corner at the section of track’s designed speed. That speed along the Tufts Curve ranges from 18 to 40 miles per hour, an MBTA spokesperson said.
“Accomplishing this work was truly a team effort with contributions from many groups, including our engineers, maintenance, capital transformation, and compliance experts,” MBTA General Manager and CEO Phill Eng said in a statement. “I thank them for their dedication and hard work to address the vital track infrastructure work. While there is still work to do across the system, the completion of the Tufts Curve section of track represents an important step towards restoring the level of service our riders deserve.”
The Tufts Curve was the focus of one of several mandated safety improvement plans issued by regulators at the Federal Transit Administration last summer.
Banker & Tradesman staff writer James Sanna contributed to this report. This story has been updated to clarify the designed speed of a recently-repaired section of Orange Line tracks.


